Equipment Breakdown Risk Index (SXI)
SCORE + CORRELATE = IMPROVE
Current SXI Score
4.77
Current Tool Use Time (min)
107.95
Tool Use Time Prediction Accuracy
97%
Target SXI Score
4.62
Target Tool Use Time (min)
(20%) 129.54
Tool Use Time Prediction Precision
92.5%
Potential Business Improvements
Current Tool Use Time (min) = 107.95
Improvement
20% or 21.59 more
Tool Use Time (min)
Improvement
88.90% or 95.97 more
Tool Use Time (min)
Improvement
177.9% or 192.15 more
Tool Use Time (min)
| Auto-ML | SXI | |
|---|---|---|
| Accuracy (%) | 62.32 | 97 % |
| Precision (%) | 63.01 | 92.5% |
| AUC | 0.62 | 0.95 |
| True Positives = 933 | False Positives = 41 |
|---|---|
| False Negatives = 19 | True Negatives = 1007 |
| ID | SXI Score | Actual Target | Predicted Target |
|---|---|---|---|
| 4627 | 9.422 | High Tool Use Time | Low Tool Use Time |
| 3346 | 1.802 | High Tool Use Time | High Tool Use Time |
| 5655 | 5.031 | Low Tool Use Time | Low Tool Use Time |
| 9214 | 5.033 | Low Tool Use Time | Low Tool Use Time |
| 4603 | 2.489 | High Tool Use Time | High Tool Use Time |
| 1099 | 9.703 | Low Tool Use Time | Low Tool Use Time |
| 5392 | 5.147 | High Tool Use Time | High Tool Use Time |
| 1619 | 3.597 | Low Tool Use Time | Low Tool Use Time |
| 1576 | 3.588 | High Tool Use Time | High Tool Use Time |
| 9826 | 2.255 | High Tool Use Time | High Tool Use Time |
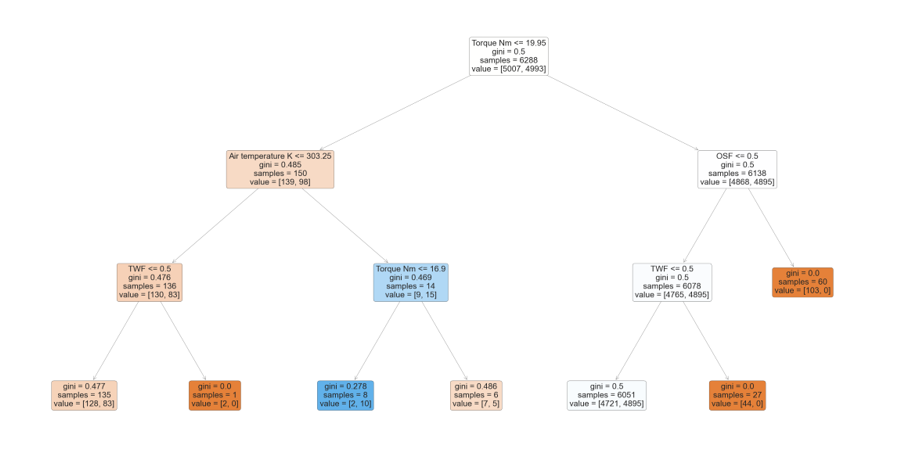
Current Tool Use Time Decision Tree
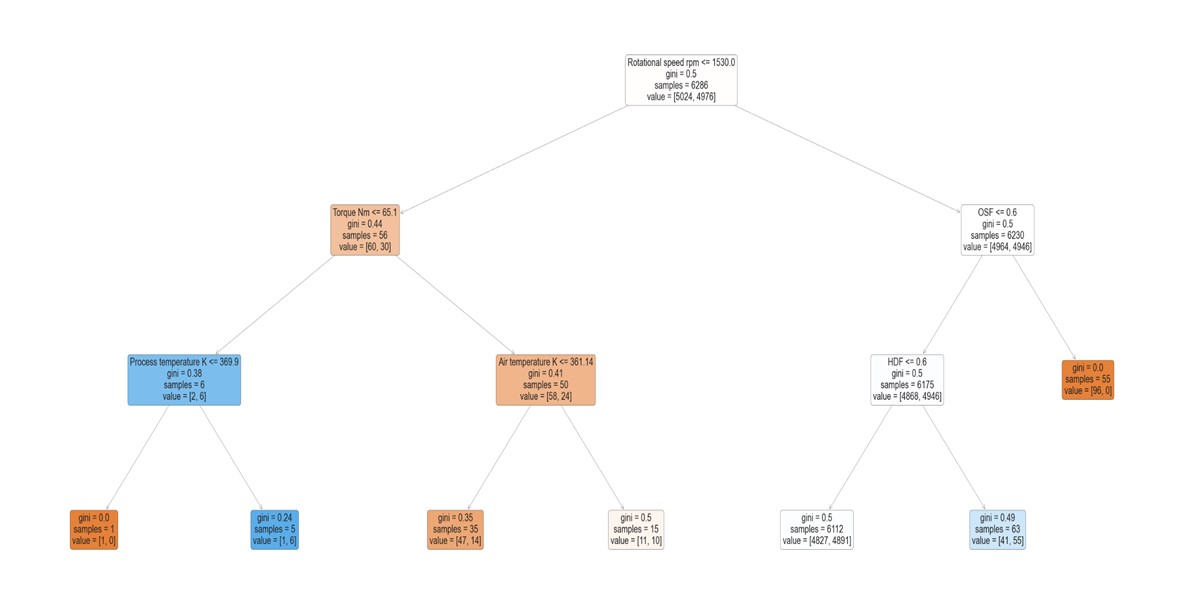
Target Tool Use Time Decision Tree
| Current Decision Tree | Target Decision Tree | ||||||
|---|---|---|---|---|---|---|---|
| Tool Use Time is Down: | Tool Use Time is Down: | ||||||
|
|
||||||
| Tool Use Time is Up: | Tool Use Time is Up: | ||||||
|
|
| FEATURES | ProcessTemperatureK | Type-L | Torque NM | Type-H | RottationalSpeedRpm | SXI | ToolWearMin |
|---|---|---|---|---|---|---|---|
| Actual Values | 307.5 | 1.0 | 42.4 | 0.0 | 1474.0 | 5.031 | 1 (low tool use time) |
| Adjusted Values | 387.45 | 1.3 | 27.98 | 0.0 | 2093.28 | 2.489 | 0 (high tool use time) |
| Weights | 0.82 | 0.90 | 0.88 | 0.84 | 0.81 | - | - |
| Change in values (%) | 26 | 30 | -34 | -10 | 42 | -50.52 | - |
The target variable changed from Low Tool Use Time (Prediction in Actual Data) to High Tool Use Time (Prediction in Adjusted Data).
Avg.Air temperature K
300.00
Avg.Process temperature K
310.00
Most common Type
Type_L
Avg.Torque Nm
39.98